Position Sizing: Equity Trading Risk Calculator

Set your daily loss budget, divide it across losing trades, and calculate a maximum position size from your risk per share.

1 Maximum Loss Calculator

Equal trade allocations · planned loss limits

Divide your daily loss budget equally across this many losing trades.

Maximum Loss Per Day (MLPD) =
—
Maximum Loss Per Trade (MLPT) =
—

Maximum loss per trade = daily loss budget ÷ number of trades, rounded down to the nearest cent.

Enter a daily budget and trade count.

Total allocated—
Unallocated—

Automatically linked while the position limit is locked.

Daily budget ÷ allowed trades, rounded down to cents. No separate per-trade percentage cap.

Cash size excludes leveraged buying power. This is a planning budget, not a live daily loss tracker.

2 Position Sizer

Manual inputs · whole shares

Locked · complete Maximum Loss Per Day to supply this limit.

Adjust by $1.00 or $0.01.

Entry-to-stop difference, entered in dollars per share.

Position Size =
—

Maximum shares · rounded down

Your answer appears here. Enter your loss limit and risk per share.

Planned loss—
Risk / share—
Planned risk buffer—
Advanced · execution costs

Add only costs beyond your entered risk distance. Avoid adding spread or slippage already included in entry/stop prices.

Added once per share; no automatic half/full spread assumption.

Shares round down after enabled costs. A fixed fee applies only to a nonzero position.

Rounding down leaves a planned risk buffer.

For educational purposes only; not investment advice. Estimates depend on your inputs. This calculator does not prevent losses or guarantee results. Actual losses may exceed your planned risk.

No account checks, data feed or orders. Inputs clear on reload.

Understand your risk buffer

Your risk budget is a ceiling—not a target.

Illustrative example · $1,000 daily budget ÷ 3 trades · $0.27 risk per share · costs excluded

Trade budget$333.33
Planned loss$324.00
Unused buffer$9.33

1,234 whole shares 1,200 rounded shares

The calculator rounds down to a simpler share count. That leaves part of your budget unused.

Why the numbers differ

Daily allocation: $1,000 ÷ 3 rounds down to $333.33 per trade, leaving $0.01 unallocated.

Whole shares: 1,234 shares × $0.27 = $333.18, leaving $0.15.

Share increments: rounding to 1,200 shares reduces planned loss to $324, leaving $9.33.

Including costs: adding $0.02 per share makes modeled risk $0.29. The calculator then gives 1,100 shares and $319 planned loss, including that cost allowance.

Using more of the budget: 1,234 shares would use $333.18 under these assumptions, leaving less room for execution differences. This calculator currently keeps its automatic share-increment rounding; there is no exact-capacity switch.

Two stops must be calculated by assigned shares × distance to each stop, then added together. They do not automatically lower total risk.

Buffers can be zero. Actual losses can exceed the plan if fills or costs differ from your inputs.
Explore more ways to manage risk

Compare position sizing, staged exits and other ideas for building your own plan.

Explore risk management →
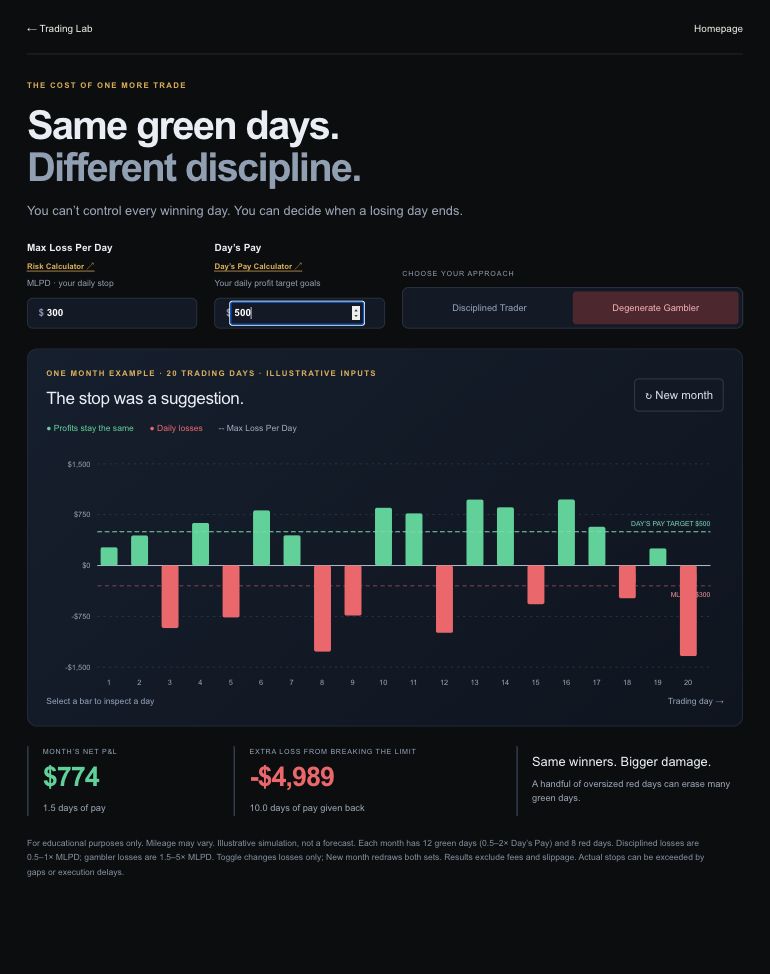
One month of green profits and oversized red losses showing the cost of ignoring a daily stop.Illustrative example · $300 daily limit / $500 Day’s Pay

NEXT · PUT YOUR DAILY LIMIT TO THE TEST

What happens when you ignore your stop?

You’ve planned your risk. Now compare a month of honoring your Max Loss Per Day with letting red days run. The winning days stay the same.

Compare a month of discipline vs. damage →