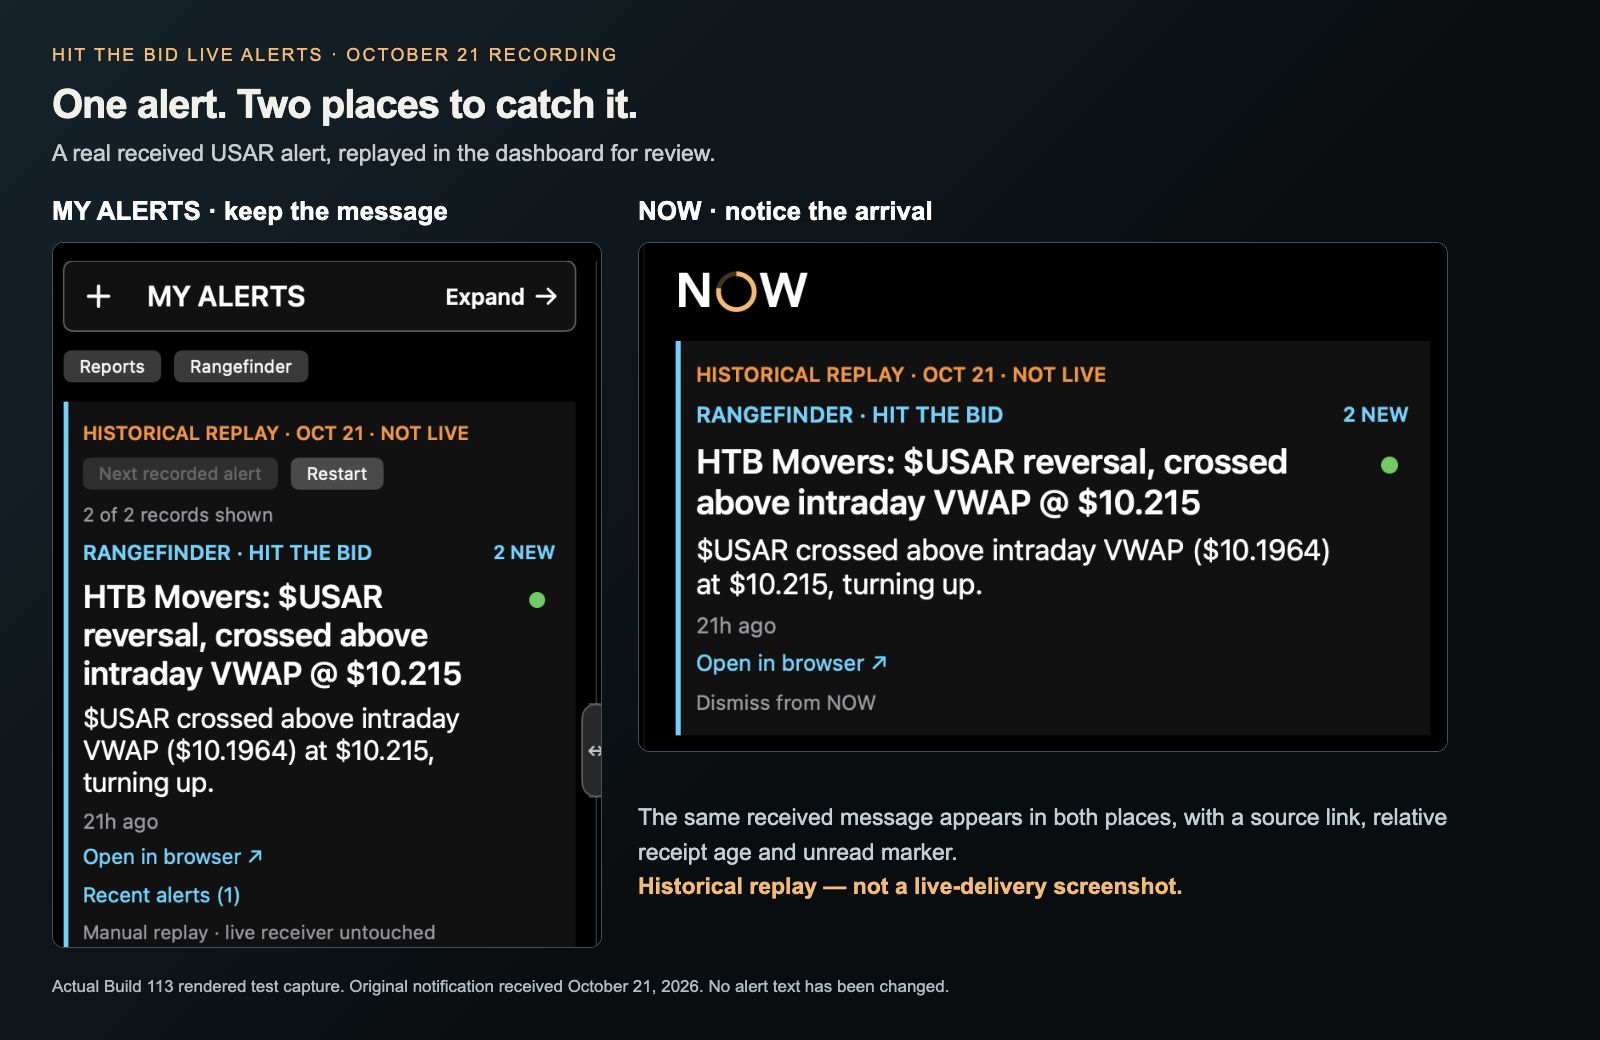
FROM THE ALERT TO THE FULL PICTURE
Click the alert. Open the full view.
The alert in My Alerts or NOW is the starting point. Click inside the alert banner to open its original Hit The Bid detail page in the browser. With that browser on the main trading display, the full chart and signal history are right there to study.
- Notice itA new message appears in My Alerts and NOW.
- Click itSelect the alert banner to open its matching HTB page.
- See the contextUse the main trading display for the chart, VWAPs and signal history.
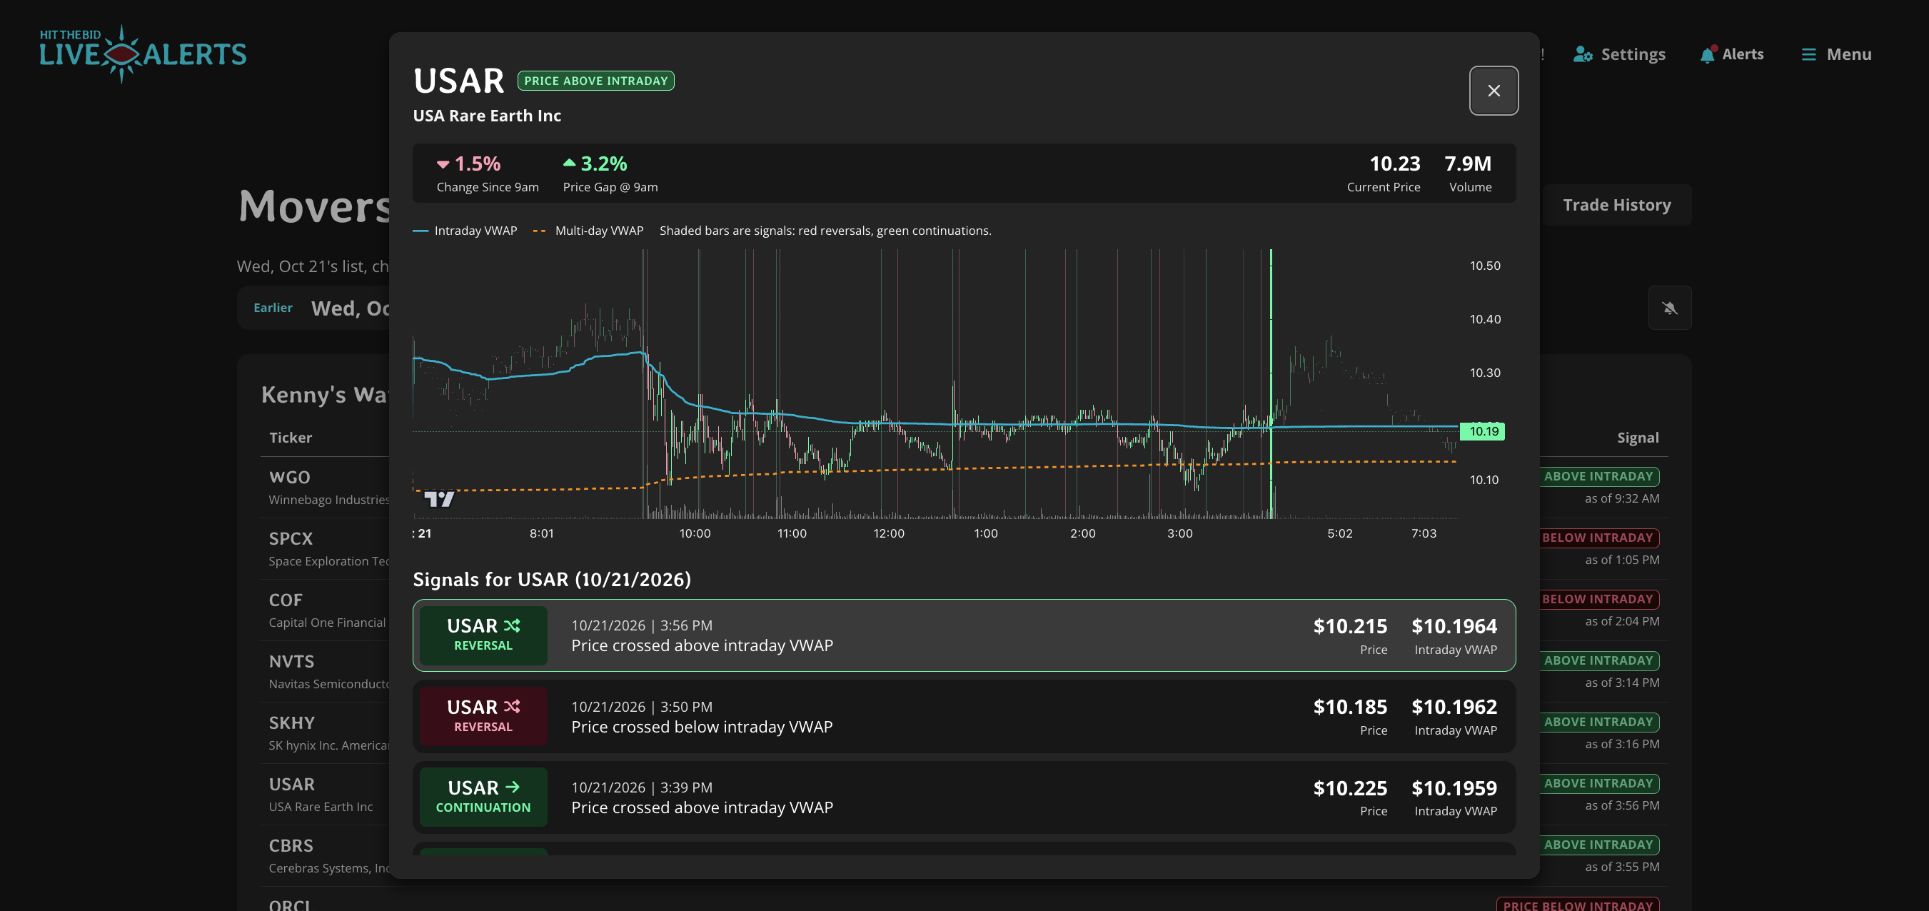
Enlarge the full HTB view
Scroll across the image to inspect the chart and selected signal.
The two views above follow the same alert: the compact notification keeps it in sight; the linked HTB page supplies the full context. The browser may ask you to sign in to your subscription.
The problem: another place to keep watching
I already follow Kenny Glick’s teaching at Hit The Bid. When the new Hit The Bid Live Alerts service on Rangefinder arrived, the question was practical: could those alerts appear where I’m already watching the clock, the chart and the next market event?
A browser notification gets your attention for a moment. I wanted the message to have a home afterward: something I could read, return to, and open at its original source without keeping another feed in view.
That became the goal for My Alerts: bring the live notification into the dashboard, give it a brief turn in NOW, and keep recent messages within reach.
What the alerts add to
The latest implementation brings the following pieces together:
- A persistent place in My Alerts. The latest Rangefinder notification sits alongside Glick’s Picks, the HTB Watchlist and earnings research, with up to five previous distinct notifications available to expand.
- A moment in NOW. A fresh arrival can occupy NOW for 90 seconds after the dashboard observes it. A later arrival replaces it. Protected countdowns and higher-priority market events keep their space, with a compact alert control still available.
- A short ping. New live arrivals request a brief, 180-millisecond sound. It follows the dashboard’s sound, volume and output settings and yields to higher-priority audio. Loading history or seeing the same notification again stays quiet.
- Readable messages. Larger white titles and body text make alerts easier to scan. Relative ages—“Just now,” “2m ago,” “1h ago”—show time since receipt; the exact receipt time remains available in a tooltip.
- Individual read controls. A green circle marks an unread alert. Click the circle to mark just that message read, or click the alert to mark it read and open its source. These read marks are local to the dashboard.
- A route back to the original. The receiver invokes the provider’s own notification click action and hands its Rangefinder destination to the browser. It doesn’t guess a destination from the ticker. A separate browser sign-in may be needed.
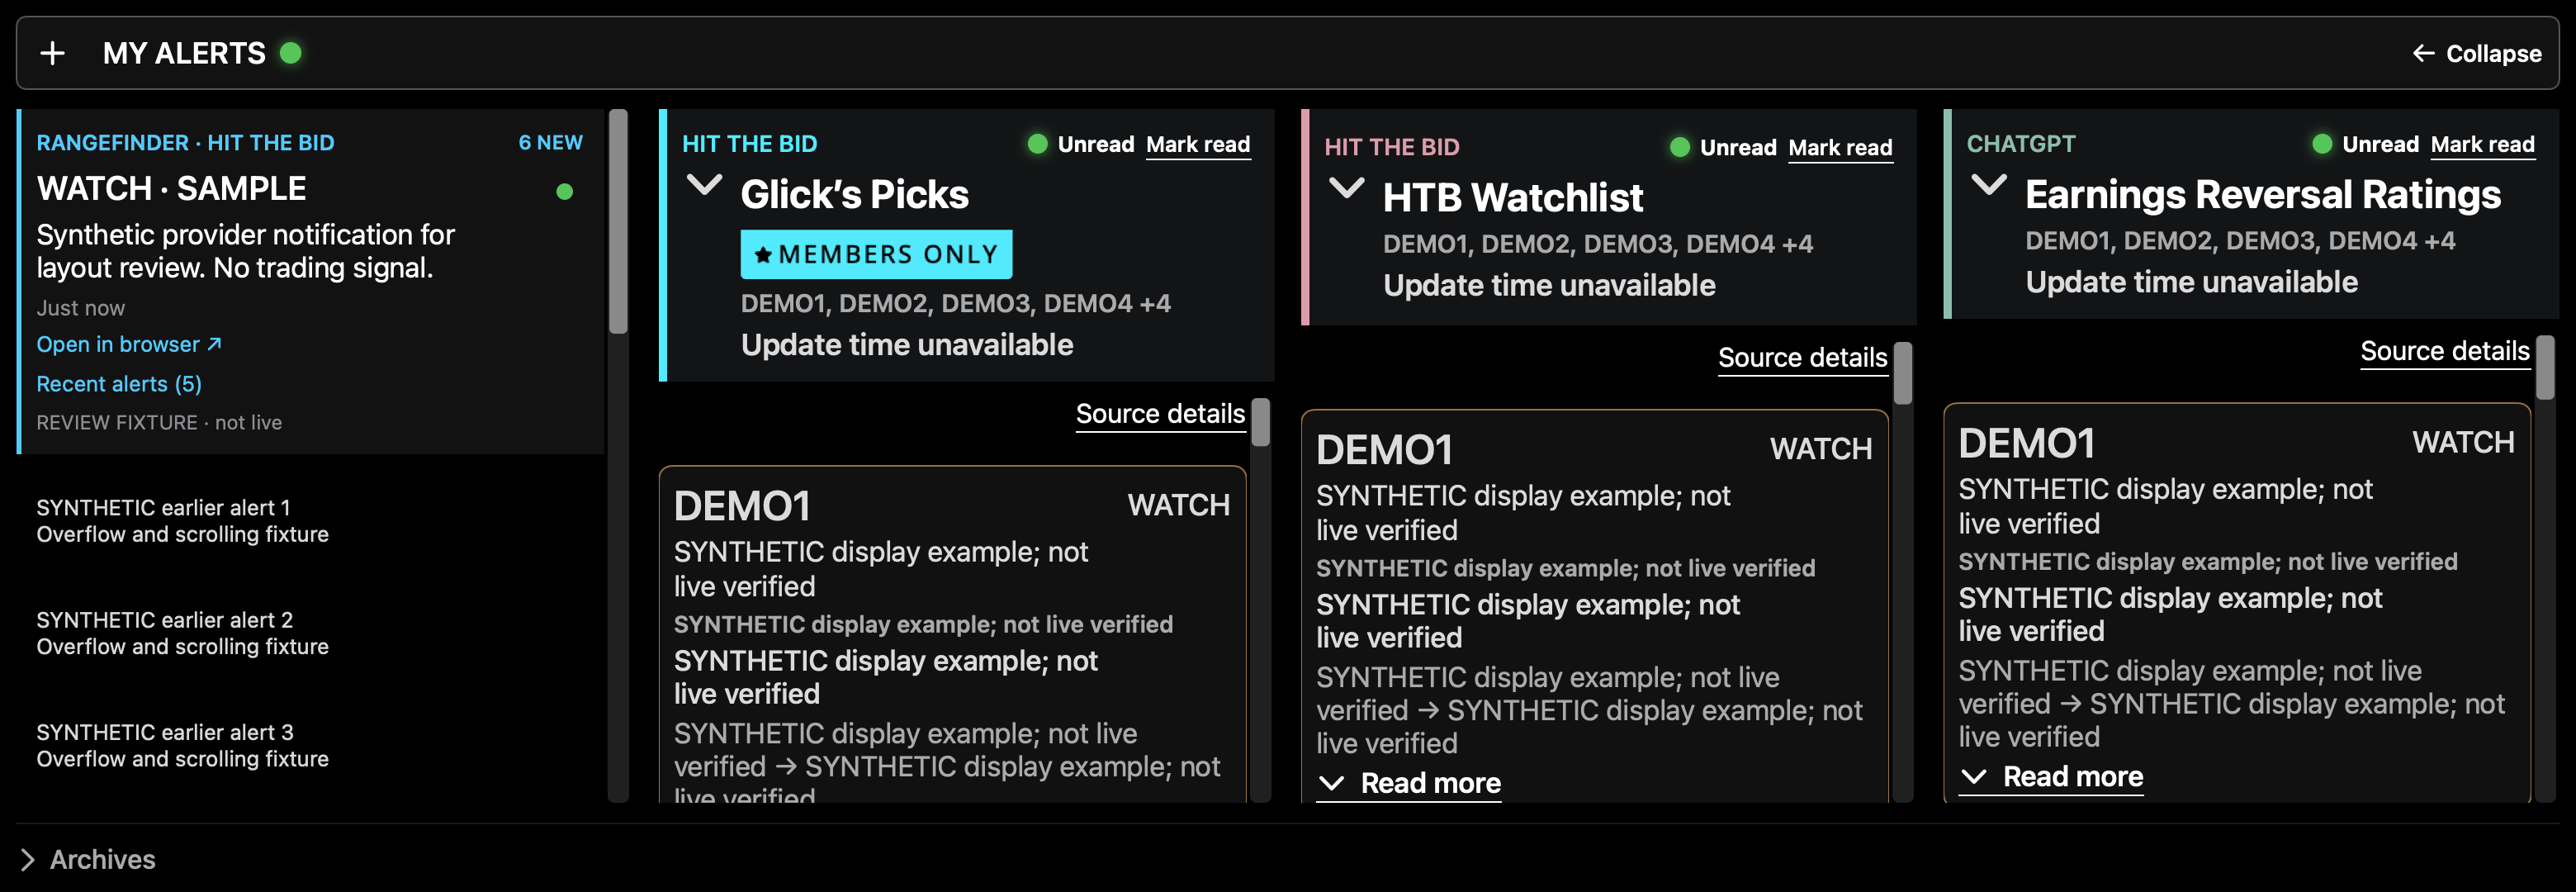
Enlarge the dashboard screenshot
Scroll across the image to inspect each column.
First, work out what the browser could actually deliver
We started by looking at the service inside an ordinary embedded browser view. Displaying a feed and receiving a usable notification are different problems: seeing the website in the app did not give the native dashboard a supported way to receive its push messages.
The next step was a small, separate receiver built with Qt WebEngine. It loaded the existing Rangefinder page in its own persistent browser profile, kept sign-in and notification permission there, and used the browser engine’s notification interface. We could then see which notifications actually reached the receiver, with a receipt count, origin and time.
We kept that experiment separate from the dashboard while investigating it. There was no need to scrape the feed, copy a Chrome login, or turn private website endpoints into an unofficial API.
Then, prove “push” meant push
One of the most useful questions in the process was simple: if a notification appears while the page is open, how do we know it arrived through Web Push?
Permission being allowed was not proof. Neither was an alert card already visible on the website. Even a notification displayed by the browser could have been created by the open page.
We added an embedded Push Messaging diagnostic panel so we could record a fresh browser push event and compare its origin and time with the notification receipt. The October 21 development record reports real push events and a successful notification click. That was the evidence we needed to move beyond “the setting is enabled.”
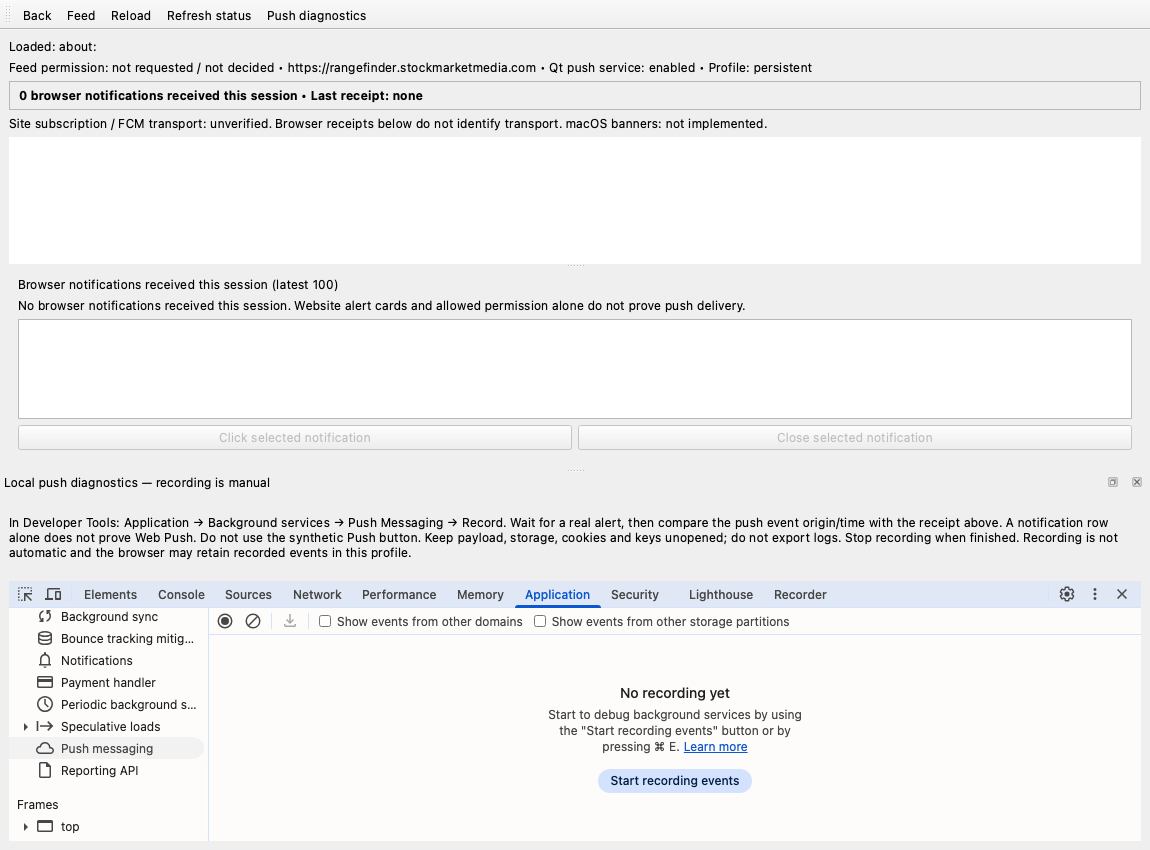
Enlarge the diagnostic screenshot
Scroll across the image to read the diagnostic controls.
That milestone established receipt for the observed events. It did not promise that every alert would arrive, that delivery would continue with the app fully quit, or that every restart and background state had been tested.
Connect the receiver to the dashboard
Once the receiver could present notifications, we added an opt-in local handoff. The receiver shares a small, private snapshot on the same Mac; the dashboard reads it and turns the messages into native alert cards. The dashboard does not need to sign in to the provider itself.
The snapshot includes a heartbeat so the dashboard can distinguish a running receiver from a disconnected one. If the receiver stops, NOW clears its live presentation while recent history remains available. Repeated snapshots are deduplicated so one notification doesn’t become several cards.
Opening an alert takes the return route: the dashboard asks the receiver to invoke the original click action, then opens the provider’s returned HTTPS destination. If that action has expired or is unavailable, the dashboard reports it instead of inventing a link.
Make the second alert as useful as the first
The next round of work came from using the feature: subsequent messages were not always surfacing in NOW. Code inspection found two ways that could happen. A notification more than 30 seconds old could miss the arrival window, and a brief connection gap could cause the next update to be treated as a silent history load.
We changed the reader to recognize recent unseen messages up to 90 seconds old and distinguish a temporary gap in the same receiver session from a receiver restart. A newly observed, eligible message gets its own 90-second turn in NOW. Startup history, duplicates and stale arrivals remain quiet.
Then came the finishing details: the short ping, larger white text, relative receipt times, and the green read circle inspired by the original service. Clicking one alert should clear one circle—not silently mark everything read.
What’s built, and what still needs checking
The receiver has observed real push events, and the dashboard implementation has been exercised with checks for repeated arrivals, delayed reads, reconnects, duplicate suppression, read-state persistence, safe destinations and sound policy. The featured image uses a real October 21 alert in a clearly labeled historical replay. The full HTB detail screenshot shows the matching historical provider page. The remaining screenshots show synthetic layout data and an isolated diagnostic view.
The latest Build 113 review package still calls for a fresh end-to-end delivery and browser-opening check, plus listening to the ping in the running dashboard. Automated tests and screenshots don’t replace those checks. This is a personal integration in development, not a generally available connector or a guarantee of background delivery.
For my desk, the purpose stays straightforward: notice a new message, understand it, and get back to the original context without losing the rest of the trading day.
Explore Hit The Bid
Kenny’s teaching and the original alerts remain at the source. Visit the service for its current access requirements and subscription details.